Universities, developers, and private industry benefit from understanding their space’s potential, especially when dealing with complex infrastructure necessary for engineering and life sciences. Having an easy way to manipulate parameters lets project owners see how various choices will affect usage and costs before committing to a renovation, creating a master plan, or developing a new property. HDR, a global architecture and engineering firm, employs its proprietary data software to help owners make decisions more quickly.
HDR has refined its use of data-driven decision making over the past decade, culminating in the development of a propriety software called Data Wrangler. The company’s data science team works with architects and planners to analyze clients’ data using the tool. HDR project leads can then bring together all stakeholders to manipulate data in real time.
“Data Wrangler is so versatile that it’s only limited by our imaginations,” says Dominick Roveto, AIA, LEED AP, education and science principal at HDR. “We’ve used it on larger capital projects, master plans, and with developers that are looking at a piece of land to develop. We can quickly show them options and begin to talk about how much square footage they can build in certain phases over time.”
Supporting Client Collaboration
Using client data to inform project plans is nothing new, of course, but taking advantage of technology allows for deeper dives and on-the-fly changes. It also supports collaboration. Whereas a traditional design process might see an architect develop and present initial plans, gather client feedback, and then spend a week or more creating the next iteration, an immersive process brings together multiple stakeholders—in person or virtually—to review plans and ideas together. This allows for more robust idea generation and immediate client buy-in.
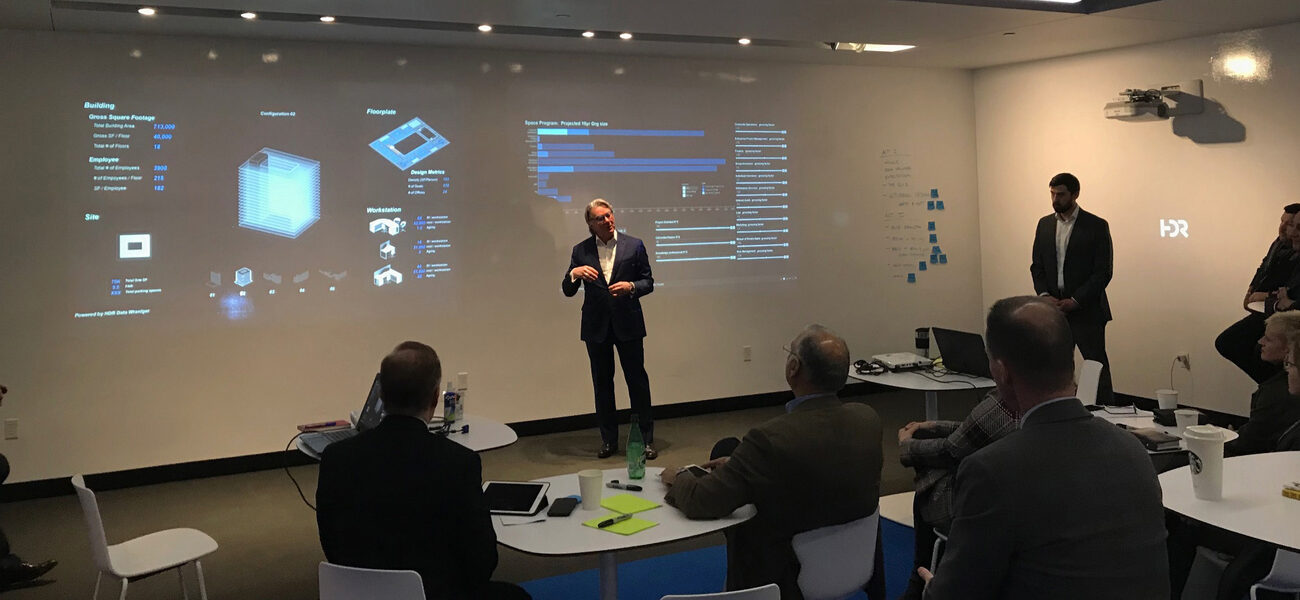
“Once you’ve got the data set up, Data Wrangler makes for accessible interactive engagement with clients of any type, from developers to universities or planning officials,” says Roveto. “Clients can say, ‘Build more in this phase, build less over there.’ Then somebody on our team can manipulate the model very quickly, and because the data is live, clients see the immediate implications of different ideas. Data Wrangler creates the playing field and we arrive at the right solutions together.”
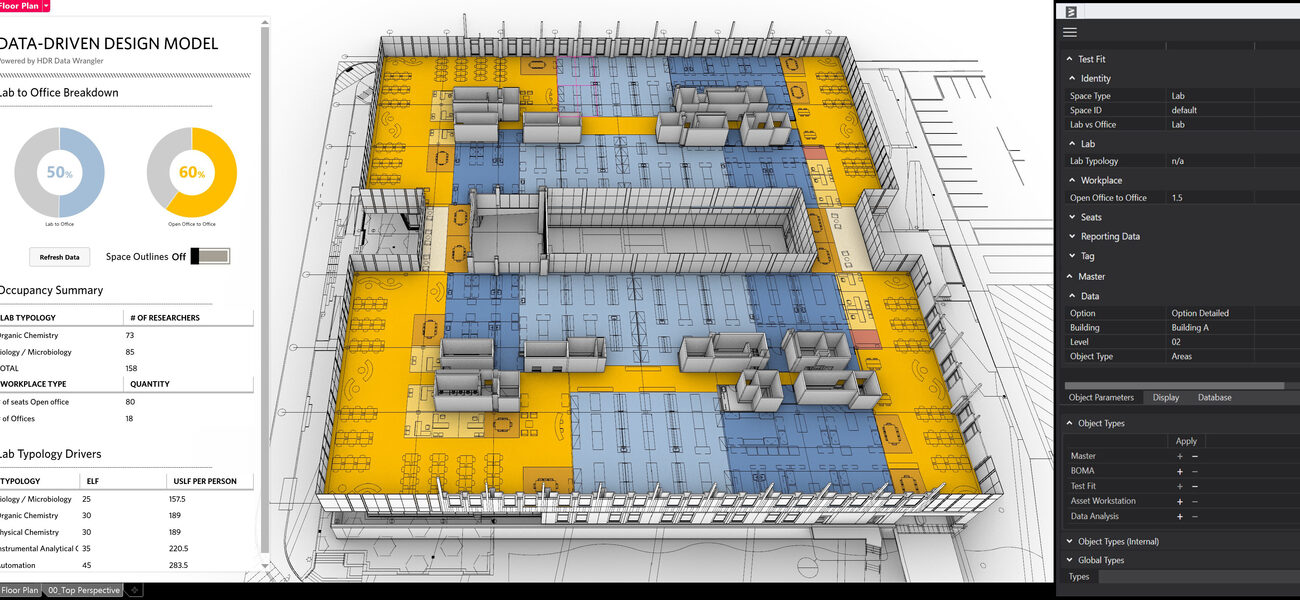
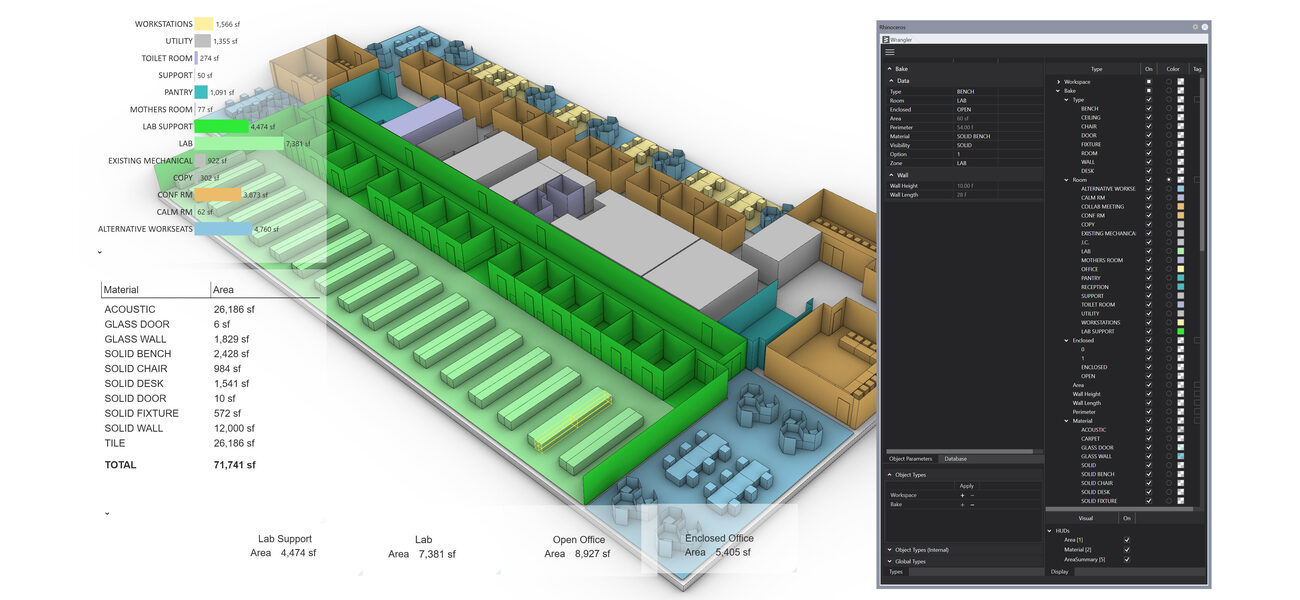
Importantly, Data Wrangler has a welcoming graphic interface and can work with other programs, such as Revit, dRofus, Excel, and custom relational database servers. It also connects with 3D spatial analysis models, so clients can easily envision how a variable—more windows, perhaps, or additional lab benches—will change the functionality and look of a space.
“A downfall of a lot of other programs is that the end result looks like some sort of a NASA spreadsheet,” says Roveto. “Nobody can understand what it is. We put a lot of energy into having a friendly graphic interface. It takes a lot of complex data and calculations and makes it look fun with simple colors and simple graphics.”
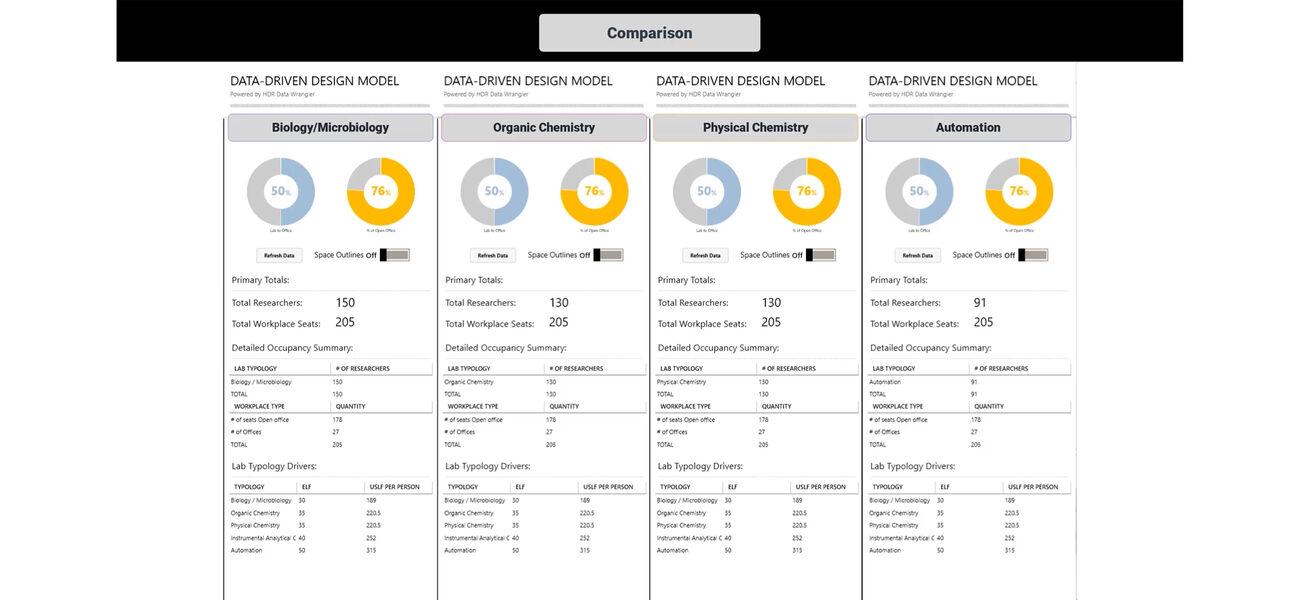
For one project, HDR was hired to analyze a biotech firm’s U.S. campus and global sites. The firm’s executives went in thinking they would need to build new space to accommodate growth. To begin, HDR’s team gathered multiple types of data—including human resources details, current square footage, size and types of offices and meeting spaces, floor plans, and infrastructure needs—which data scientists used to create a customized interactive Data Wrangler dashboard. When discussing ideas with clients, architects could then change inputs and metrics and display results immediately to illustrate various potential layouts. Ultimately, HDR’s analysis of need versus current space, along with its efficient planning of renovations, showed that the biotech firm could handle growth without any new construction. Instead, HDR was able to reduce the company’s per-headcount space from 250 gsf to 150 gsf and achieve a 47 percent increase in capacity across the existing main campus buildings.
“By investing money in the model, we got the answer that said the firm could grow without building new,” says Roveto. “It’s better for the environment, it’s better for the client’s budget. And this project culminates in a living dashboard that memorializes all those decisions. It’s not something the client can manipulate or change on their own, but it’s a handy way to record what they decided and the data that went into it so they can share the results with other people. In the future, we can change or add to the data and come up with new ideas.”
Showing Options for Spec Space
In Boston’s Seaport District, developer Related Beal hired HDR to design Innovation Square, a life sciences development comprising two buildings totaling 420,000 sf. The buildings were constructed on spec, with an assumption of a multi-tenant environment. HDR used Data Wrangler to show the buildings’ versatility and how different floor plans could accommodate various tenants.
“We could very quickly show the developer how wonderfully flexible the building was,” says Roveto. “The developer could then show the kinds of science that could be done in the building, as well as what kinds of employee counts, numbers of benches, or square footages to expect—the kind of metrics a tenant would care about when they’re considering renting space.
A starting point was to define what HDR calls the matrix of responsibility—what the landlord and tenants would each provide—to help brokers and leasing agents sell the space. Labs require significant infrastructure, but unlike in academic institutions, each commercial tenant becomes responsible for its own systems. That might necessitate multiple lab waste systems and chemical storage spaces. Certain amenities, such as general water supply and standby power and air, fall under landlord responsibility and take up communal building areas. Then companies receive a percentage of space for specialized infrastructure, depending on the number of tenants.
“When we don’t know how big or small tenants are going to be, it’s always about planning for the most difficult or challenging scenario,” says Alan Fried, AIA, LEED AP, senior project architect at HDR. “For this project, it was how do we accommodate a lot of tenants? But first and foremost, it’s about understanding those lines of responsibilities and how we actually lay something out so the cores work properly. The bones aren’t going to be able to move later. How do we get those in the right places for maximum flexibility and adaptability for the future, not just for the first tenant, but when tenants two and three down the road need to do something different?”
Committing to Data Science
Companies considering a data science program need support from top executives to get started because of the fairly significant investment in both personnel and computing power.
“It’s always evolving, and you have to keep bringing fresh folks into the mix and keep staff trained on real-world projects,” says Roveto. “It isn’t like you spend a little money up front and you’re done. It’s a continuous investment to stay useful.”
It might also require an organizational culture shift. Data on its own is not worth much without subject matter expertise behind it, which is why HDR focuses on building multidisciplinary teams. Data scientists who build custom client dashboards work alongside experienced architects and planners who understand specialized building processes and can spot inconsistencies.
“You still need to understand the data that you’re analyzing,” says June Hanley, LEED AP BD+C, principal planner at HDR. “If a client has something in the wrong column, I will catch that just by looking, whereas the data scientists might not. You can make data say anything, but you’ve got to figure out that you’re telling the truth.”
By Amy Souza


