
Johns Hopkins Applied Physics Laboratory
Courtesy of Johns Hopkins APL
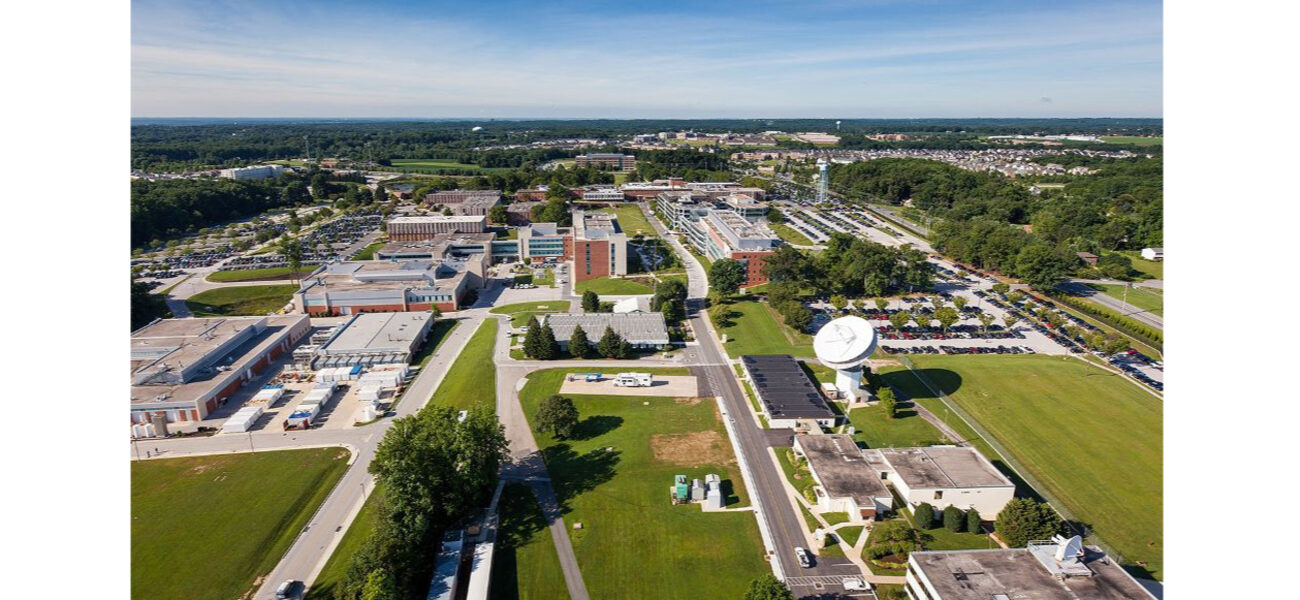
The Johns Hopkins Applied Physics Laboratory (APL) in Laurel, Md., is a not-for-profit University Affiliated Research Center. It specializes in air and missile defense, naval warfare, computer security, and space science, and serves as a technical resource for the Department of Defense, NASA, and other government agencies.
Badging Data
Courtesy of Johns Hopkins APL
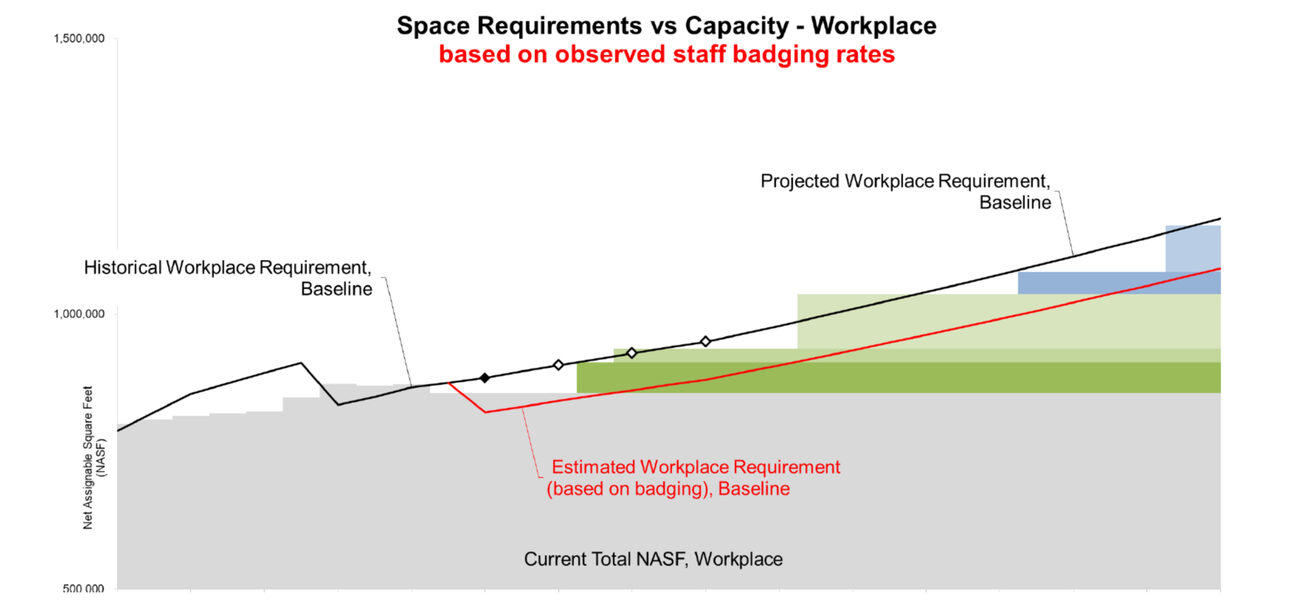
Daily badging data generated by the more than 8,000 workers at the Johns Hopkins Applied Physics Laboratory (APL) provides valuable information for determining long-term capital construction needs and short-term opportunities for more efficient space allocation.
Highly accurate badging data generated by workers at the Johns Hopkins Applied Physics Laboratory (APL) in Laurel, Md., is giving space planners and administrators powerful new insights for making more efficient space planning decisions in the post-pandemic era. As the nation’s largest Department of Defense University Affiliated Research Center, the 450-acre campus consists of nearly 4 million sf of space, including cutting-edge cybersecurity, spacecraft, and robotics facilities. Badging data from APL’s 8,000-plus workers provides detailed information for comparing projected space needs with the hybrid utilization behaviors established during the COVID-19 pandemic. These new data-driven insights are now being used to inform decision-making for high-cost capital construction projects and short-term space planning initiatives.
“We are an entirely research-focused division,” says Wendy Hess, space manager and planner at Johns Hopkins APL. “With very few exceptions, we have no faculty, no doctors, no students, and no classrooms. Due to the kind of classified work we do, our campus is extremely secure. Everybody—including visitors—is badged in through turnstiles that are monitored by security guards who verify their credentials, so our daily badging data gives us an extremely accurate headcount of who is on campus at any given time.”
According to the institution’s growth projections, APL was facing a shortage of approximately 150,000 sf of office space and 100,000 sf of lab space in 2020. But analysis of badging data captured during the pandemic identified opportunities for a more flexible and efficient approach to space management.
“Life at APL quickly became a split screen when the pandemic started. On one hand, we have a lot of work that must be done on campus: classified analysis, biology and chemistry experiments, assembling spacecraft. So, lots of people were still coming to campus on a daily basis, which meant we had to pay a lot of attention to social distancing. But on the other hand, many of our staff were also spending a portion of their time working from home for safety reasons and other family considerations. This meant that there were a lot of empty offices around campus, and we saw this as a huge opportunity for accommodating the need for social distancing over the short term.”
In order to accommodate social distancing needs, APL created an “empty offices dashboard” that used daily badging data to identify spaces that were being underutilized so they could be temporarily repurposed.
“If you were on campus less than twice a week in 2020, we may have had a conversation to say that we need to temporarily use your office for something else. Everybody was very supportive of this, and it helped us keep our campus safe for the staff members who had to be there on a regular basis to do their work. But then we started seeing [post-pandemic] trends in the badging data and wondered if we might be able to adapt some of the positive impacts of this new hybrid work culture that had suddenly sprung up.”
After space planners analyzed the data trends, APL executive leadership developed new HR categories for assigning offices and conference rooms, which leveraged emerging hybrid work models to optimize space allocation based on where staff members were expected to do most of their work. The revised categories were defined as “flexible” (staff who work on campus more than three days a week), “local” (staff who work from home three or more days a week) and “remote” (staff who work more than 100 miles away and rarely come to campus).
“Offices and conference rooms—what we call ‘Workplace’—are directly impacted by badging data, because you are either on campus or you’re not. APL already had established space standards for square footage of Workplace space per person, so we looked at how we could prorate that for staff members who were working from home a large portion of the time,” says Hess.
While APL maintained their existing standard of 118 nsf per staff member, space was prorated at 50% for staff members who worked from home three or more days a week (defined by the APL work arrangements as “local.”)
“Local staff now use shared hoteling and touchdown spaces when they’re on campus. Of course, they still have access to all of their laboratories, conference rooms, and support spaces, but they don’t have an assigned office,” says Hess.
APL implemented the new data-driven work arrangements in 2021 with the amount of net square footage per staff member assigned from the outset. The change resulted in significant cost savings by allowing for the more efficient use of existing work spaces and more strategic long-term construction planning with an emphasis on creating new lab space.
“When we applied the APL work arrangements in 2021, we suddenly had a bunch of space available. We continued to hire and we continued to grow; we simply needed less space,” says Hess. “Our CFO was really excited about this, because it meant we could delay other office and lab buildings. While we usually have about a 50/50 split of offices and labs, our data showed that we didn’t need the added offices. So we were able to plan for a new building focused entirely on lab space that will contain lots of big, heavy equipment that all needs a home. This was the first time in APL history where space planning was part of the conversation from day one. We weren’t tagging along on this change; our data helped drive it.”
As critical as it is, badging data provides just one piece of the puzzle.
“Each department gave us an estimate of the number of staff members that they expected to be on campus most of the time in the post-pandemic world, which varied based on each department and what they do,” says Hess. “Now we can compare those targets to the actual data and see the proportion of staff who are coming to campus on a weekly basis. It doesn’t really matter what the category in your HR file is. The question is: What are you actually doing every week?”
When APL’s existing space standards were compared to observed and official utilization data, they found a 750-seat difference between the number of staff who are expected to show up weekly and the number who actually do. The challenge in solving this discrepancy is that badging data alone doesn’t tell the whole story.
“If we assess our space needs based strictly on how our staff are acting, 750 seats is a lot of building and it’s a lot of money. But badging data is more than just a bunch of zeros and ones. In reality, it’s a measure of staff behavior—and staff behavior is a big piece of the organizational culture. So our executives are now looking very hard at this data and thinking about how the staff act and why they act that way. We are looking at all of the pressures on our campus, and we are working to plot a course that brings the campus plans and our actual behaviors into closer alignment. The thing to remember in all of this is that a data set by itself is not going to create wholesale cultural change, but it can serve as a catalyst for asking the right questions.”
By Johnathon Allen