The University of Wisconsin School of Medicine and Public Health is using data science to improve existing space efficiencies while fulfilling departmental growth and retention goals, reducing leased space, and fueling master planning efforts. Data analytics has become a fundamental tool since facilities staff undertook an extensive data collection and analysis project and applied what they learned to develop space assignment rules and processes.
Many institutions, UW School of Medicine and Public Health (UWSMPH) included, have limited vacant space yet need to support human resource requests for labs and offices.
“We have noticed a heightened state of activities related to space needs due to ongoing research as well as supporting developing COVID research and health care needs,” says Randi J. Smith, AIA, supervisor and laboratory project manager for Facilities Planning & Delivery at University of Wisconsin-Madison (formerly the UWSMPH facilities planning associate director.)
“The stark reality is there is no new space, only reclaiming and making better use of existing space with the current available funding. We are also not in the business of turning away our principal investigators when they want to request grants and increase staff to support those grants. So, how do you use data science to inform a space master plan and meet your organization’s growth in a collaborative, effective, and efficient way?”
Data science allows the examination of large datasets to help organizations develop processes and make decisions. A well-designed data analysis venture can help institutions make the best use of space and potentially save millions of dollars in deferred new construction. It’s not a quick, easy, or one-off project, however. Making a commitment to gathering, maintaining, and understanding data requires time and resources.
“It can feel overwhelming, like trying to scale Mount Everest,” says Craig Kramer, UWSMPH director of space management. “But just getting started is the best way to get to the top of the mountain. The more mindful you can be about how you’re going to analyze data in the future can help you structure how to start collecting it.”
Kramer suggests starting with a strong data governance framework, which has five main components:
- Ownership—Where will data reside and who will maintain the repository?
- Accessibility—Who can access or change the data?
- Security—How will you establish and enforce roles for each user?
- Quality—How can you ensure collection of correct information?
- Knowledge—Who are the sources with a deep understanding of the data?
He also recommends creating a data dictionary to ensure that key terms are understood by everyone involved. “For example, our HR department assigns job codes to all employees, but supervisors are the ones who assign working titles,” he says. “We found that our accountant job code actually had seven different working titles. Knowing this allowed us to better qualify our data.”
It’s important that data collection gets treated as a collaborative process, as well. At UWSMPH, facilities staff own the data project but they are transparent about how information is collected, used, and shared back to UW-Madison’s campus Space Management Office. In addition, they share any analyses or visualizations with departments to help them better understand their own data.
“We collaborate with departments, centers, institutes, and programs,” says Kramer. “Within each one of these groups, we establish a key contact who will be our source of data truth. We don’t want to have multiple people giving us different updates on our data; otherwise, the data can quickly degrade.”
Getting Started
Data scientists can use computer power to sift through large quantities of information and conduct predictive analyses, but organizations don’t necessarily need full-on data science capabilities to find value in their information. They can get started with the tools they have on hand.
UWSMPH has 5,400 employees (plus another 3,300 postdocs, students, fellows, grad students, undergrads, and interns) and 30 buildings, including leased spaces. Prior to the school’s initial data analysis project, people and place details hadn’t been centralized or shared but instead were maintained by various departments. Breaking down those data silos was key. Prompted by the dean’s office to collect information—in part to comply with a Facilities & Administrative federal grant audit—Smith and a colleague spent more than six months learning all they could about how departments use their space. Having a leadership directive made it easier to get departments on board as Smith met with department administrators to obtain accurate data.
“Admins know their space pretty well. We just had to create a way to gather data in the most painless way possible for them,” says Smith. “We scheduled meetings with them and brought a laptop. We gathered information at that point in time, coded it for consistency, and kept in touch for any clarification later on.”
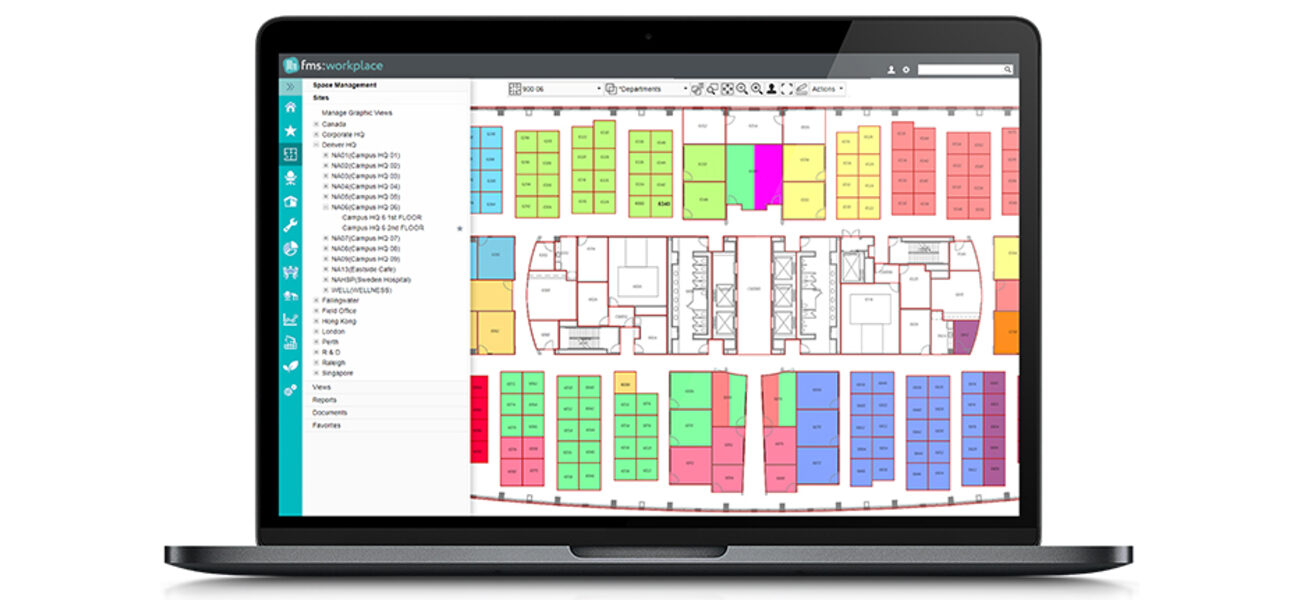
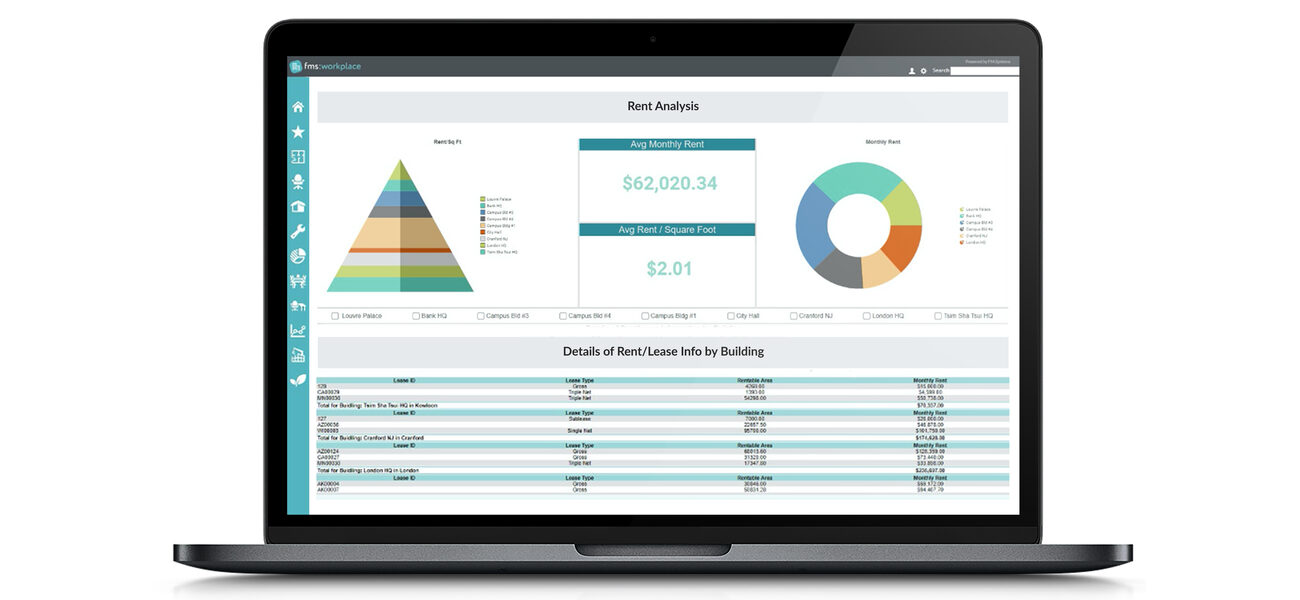
Smith ended up with a Microsoft Excel spreadsheet containing 16,000 lines of data—everything from occupant names, job titles, and full-time equivalent status to office and lab sizes and locations. That initial data gathering and analysis fulfilled the school’s audit needs and also helped Smith and Kramer, along with leadership, develop guidelines for future office and lab allocation, an ongoing process as requests continue to surpass availability of vacant space. Now, however, the school has transitioned to cloud-based databases and more powerful software that allows for interactive floor plans, data dashboards, and scenario planning impact reports, as well as analyses that include graphs and other visual elements.
“Software like this allows us to take space data, run test-case scenarios, inform policies, create guidelines, and inform our master planning efforts,” says Kramer, who now manages the school’s data project and has helped it evolve.
Having a snapshot of data in one central repository allows architects to ask questions they couldn’t have easily answered before. How many wet labs does the school have? How many are assigned? If only 90 percent of them are being used, what’s happening with the other 10 percent? Smith notes that offices remain a driving factor of planning efforts. The school shares space with the university hospital, and some employees work in both locations—meaning they might have two offices, neither of which is used full time. Does it make sense to leave those office assignments as is?
“Leadership needs concrete information about how we use space to make informed decisions on how to best utilize it in the future,” says Smith. “We’re landlocked here. It’s important that we use space and financial resources wisely.”
Developing Guidelines and Test Cases
Facilities staff don’t determine how much space a department gets. Rather, they provide data analysis to help the dean’s office understand what’s possible. Leadership then works with department chairs to devise equitable arrangements that best serve the school’s mission. In most cases, current space is grandfathered and new guidelines are applied only when departments request new space.
“We are charged with making the best use of space from a holistic standpoint, but we’re not in the business of taking things away,” says Kramer.
Guidelines informed by the data analysis were tested to explore their ramifications if fully implemented as rules. For example, an office test case run on a 130,000-gsf faculty office building included four rules: One primary workspace per person, with all others shared; part-time employees (less than 50 percent FTE) to occupy shared offices; private administrative offices restricted to dean-level administrators and director; and faculty with primary research and/or academic duties and little clinical activity to occupy shared offices.
Applying these rules could potentially decrease single offices by 23 percent and increase shared offices by 10 percent, resulting in a 13 percent office vacancy.
“We wondered if this was an anomaly. Was this something that we could find consistently across three more buildings in the coveted clinical campus adjacent to the university hospital?” asks Smith. “That answer was yes. As a matter of fact, we can find more space. That equated to about $16 million worth of deferred costs of new construction, using vacant spaces within the existing footprint.”
Examining Leased Spaces and Remote Work
The UWSMPH team also used data to evaluate whether it made sense to renew or cancel various leases. Its current portfolio includes $3 million worth of annual lease costs in a smattering of buildings on the periphery of campus.
“The first step was to evaluate the leases by creating variables to quantify them and then analyze the viability of ending the lease, turning the subjective into an objective number,” says Smith.
Leases were given ratings, low to high, based on a variety of criteria, including whether a space was particularly specialized or its geographical adjacency desirable. High-rated (rating three) leases made sense to maintain, while leases rated a one might not. For example, the Center for Tobacco Research and Intervention, which has a research smoking shed, could not be brought back to the tobacco-free campus. And the OB-GYN department’s leased space is adjacent to the local affiliated hospital with a labor and delivery unit, while the university hospital does not have labor and delivery. Continuing those two leases made sense.
For other buildings, the data allowed examination of lease renewal times, lease-break penalties, and comparison of current costs to market rates.
“Now that the leases had a quantified rating, leadership could evaluate in a single spreadsheet where we should focus our energy to reduce costs,” says Smith. “When all the rating-one leases were folded back into the campus footprint, we had a savings of about $1.2 million a year. We have five-year leases, so that’s about $6 million that can be put towards savings for a new building.”
During the COVID pandemic, many UWSMPH employees switched to remote work. Departments continued hiring people, as well, most of whom worked remotely for months or years.
“Now they are looking at coming back to campus, so we are seeing an increased demand for offices,” says Kramer. “If everyone came back to work full time on site there wouldn’t be room for them.”
By looking at current space and new-hire information, Kramer was able to run a test-case scenario factoring in remote work possibilities and let the data inform how many people could feasibly return to campus. Twenty percent of non-faculty employees remaining fully remote turned out to be the sweet spot. If that didn’t happen—and if the new rules of office allocation assignments were not implemented—the school would need an additional 50,000-sf building to house new employees at an estimated cost of over $20 million.
Without robust data collection and analysis processes, the school would have been guessing at what was possible. But UWSMPH facilities staff now can provide school leadership with detailed information and visualizations to help inform space use. Though getting a data program up and running takes time, it’s well worth it for the ability to make data-driven decisions.
“I can’t stress enough how useful it can be when done with data integrity,” says Smith.
By Amy Souza


