With an overwhelming amount of space data—collected from and managed by RFID chips, space utilization models, visual schedule maps, BIM—the best outcomes increasingly rely on the ability to analyze, distill, and communicate that information, according to Jeff Funovits and Alex Wing, principals with Stantec. This is particularly true when it comes to the design and planning of medical, research, and educational environments, where efficiency and meaningful learning or clinical outcomes are the measures of success.
“We are trying to design spaces that best fit the clinical, research, or academic mission,” says Wing. “That is the goal of using analytics to plan these facilities. But the key is to not only gather the relevant data, but to be able to understand what it reveals.” Healthcare institutions, says Wing, are ahead of the curve because they are part of a competitive market. He points to a recent Modern Healthcare article about a hospital in Kissimmee, Fla., that has successfully used radio frequency identification devices (RFID) to track staff movements, revealing underlying patterns that led to bottlenecks.
While Stantec was not involved in that study, the methodology is familiar to Wing and Funovits. “Typically we collect data about which staff went where, and then analyze it with overlapping data like work schedules and patient admission schedules to determine why people are behaving the way they are,” says Wing. “It turns out that with some small changes—say, to rescheduling ICU maintenance or equipment change-outs—you can get some big efficiency improvements.”
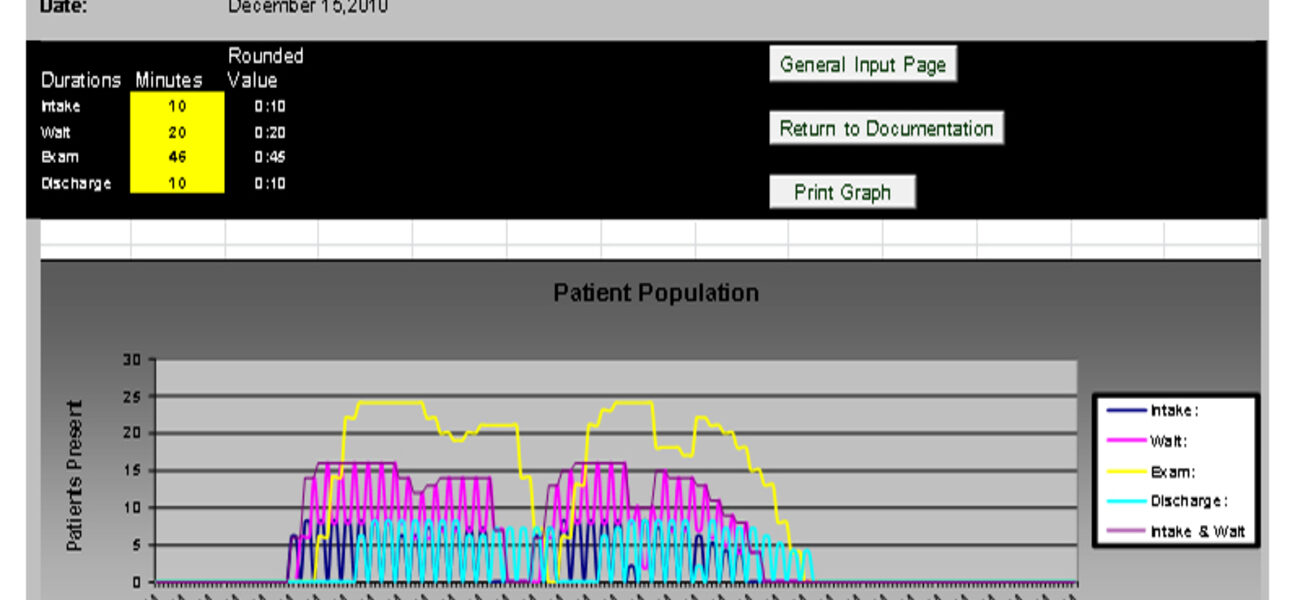
Other ways planners can create practical models from the data they collect include developing curves that depict how many rooms are in use at a given time, revealing opportunities for optimization. “Let’s say the model you develop looks at moving people through a surgery,” says Wing. “The data is about pile-ups that happen in the intake process, in the waiting area, in the exam room; you create a curve that depicts each component. The meaning you then extract from that is the peak number of people that are sitting in each of those spaces at any given time, which lets you know exactly how many spaces (such as exam rooms) are necessary.” These improvements in efficiency ultimately result in shortened wait times and increased patient satisfaction, a bonus in a market where consumers can choose which clinic to use.
Efficiencies in Research Facilities
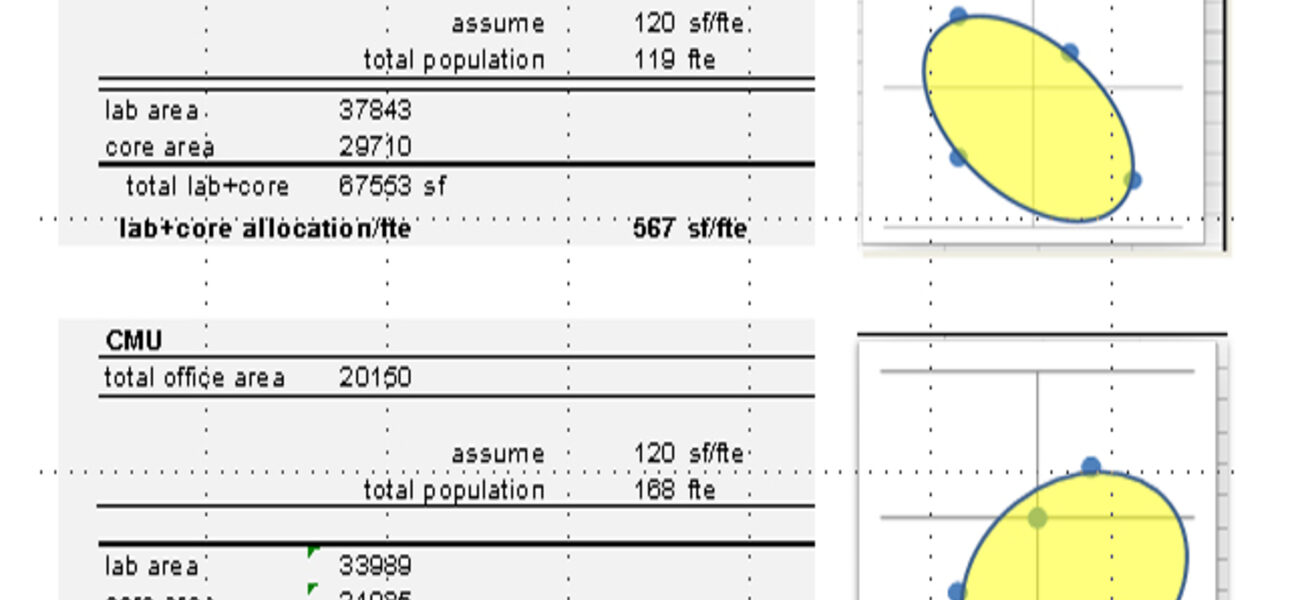
Competition in research similarly drives space planning, in large part because grant dollars are linked directly with the size and type of facility in which the work takes place. “For biomedical, for example, the grant size is directly related to operating cost. It’s a correlation that actually works: If you want to encourage productivity, you have as many staff as you have square feet for,” says Wing. By developing models based on assigning an amount of space per researcher or graduate assistant, planners can modulate the amount of space each research group gets. If a group becomes less productive, the space can then be re-allocated. “(Research facilities) find these models relatively easy to implement, because grant dollars are already a metric they’re tracking to benchmark themselves against their peers,” says Wing.
Typically, research facilities have been designed to support a certain kind of team. But across the sciences, a more interdisciplinary approach is becoming common, which in turn is driving the way the spaces are planned. “What you measure—in this case, the number of full-time employees required by each particular research discipline—affects what you plan,” says Wing. Rather than creating a “bullpen” with a large, centralized core, a multidisciplinary facility might have decentralized “skunk works,” experimental laboratories tackling specialized research. This approach to space planning tends to encourage collaboration among disciplines. “Take bioengineering, where chemists and biologists and engineers might be working side-by-side in a skunk works,” says Wing. “Getting people with different perspectives together increases attack on a problem and arguably helps them be more effective. These facilities are proving to have outcomes that are as good if not better than these giant bullpens.”
Academic Settings
Learning environments present a different set of challenges for planners looking to diagram how spaces might better support a school’s mission. Unlike research facilities, which look to each other for benchmarking, educational institutions are unique, and strive to remain so. “We don’t encourage them to benchmark holistically, or cobble together models from other institutions,” says Funovits. “Each has its own character and, while they want to offer the best to their students, what that looks like is going to vary from school to school.” At schools that Stantec has studied, the question is often, “How do we right-size our inventory to support our strategic mission?” To answer, planners create visual maps of class schedules and track them over time. “If you drill down into this, you begin to see the peak load of each classroom type for any given hour, any day of the week, and you can begin to study the effects of rescheduling and changes to the mix of classroom types,” says Funovits. He points out a familiar pattern that many schools share: times when space is chronically underutilized, often in “unpopular” slots, such as late on a Friday. Recapturing this space can often support enrollment growth without the need for new construction.
On the other hand, Wing adds, “It’s not wise to design around being full all the time.” One solution, implemented at the University of Massachusetts, was to explore the schedule impact of awarding four credits rather than three for similar time-slots, with the additional credit being earned outside of the classroom in group-based/project-based settings. Combining this with the strategic placement of these courses in “primetime” slots had the added impact of maintaining healthy enrollments in these courses.
While the strategy improves overall utilization, more importantly, it promises to yield better learning outcomes. “The mechanism is to have a portion of the work performed outside the classroom, either online, in the field, or on a project-type basis,” says Wing. As with the collaboration provided by multidisciplinary research, a more decentralized, team-based approach to learning can improve outcomes. “At UMass, all of the classrooms had too many chairs in them,” says Funovits. “You couldn’t get to the sidewalls. You couldn’t move around.” To match the university’s educational mission, it became clear that downsizing the number of chairs per classroom was critical. “That way, teachers can teach the way they want to teach, and students are getting that team-based learning outside of class.”
Master Planning with Data
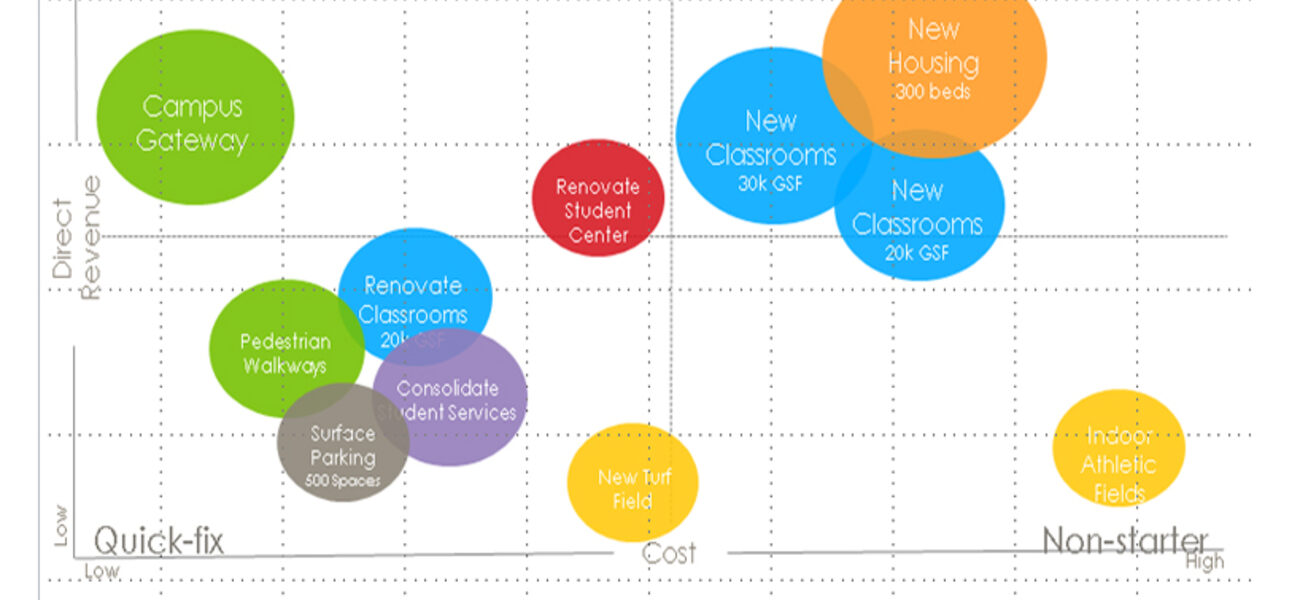
Data also informs the master planning process, although Funovits stresses that it is the way in which the data is used to drive conversations with stakeholders that makes all the difference. “You can collect data in a lot of different formats—from surveys, space types, deferred maintenance. But a lot of times what happens is that data gets tabled, or it’s viewed as ‘Well, this is what we have, but it isn’t really what we need.’” Again, visualization helps all involved to see the patterns within the numbers. In one example, Stantec had focus groups rank types of projects in terms of priority, and correlated these rankings with projected costs and strategic advantages to the school. While members of the focus groups might have ranked the project types in completely different ways, plotting the rankings in this manner allowed individuals to better understand the results of their decisions.
“We always talk about building understanding rather than consensus,” says Funovits. “You’re rarely going to get consensus via a poll. But if you look instead at why one person thought something was such an important project when someone right next to them thought it wasn’t important at all, you open up a dialogue.”
There can definitely be too much of a good thing when it comes to data. Building information modeling (BIM) software offers a robust system for managing an entire facility or campus. However, Funovits cautions, most institutions don’t have the resources to devote to data management. “Everyone wants buildings done in Revit®, but the problem is how they actually use it. Smaller institutions can’t afford a BIM operator. There is a buzz out there about linking all this data through integrated software. But the issue is still that if no one is managing that data, it becomes useless.” Stantec is currently developing a simplified application, not planned for use with a facilities management database, that administrators and boards of trustees can use to track master plan implementation. When projects are completed, they are toggled as “done,” and the master plan updates automatically.
Higher education may be at a disadvantage when it comes to approaching the cutting edge of big data-driven planning, in part because of that desire for uniqueness. “There is a shared database being built across the country for research institutions, looking at lab performance,” says Wing. In other words, the data is out there; it is up to the planning and design professions to find the best lens through which to view and share it.
By Liz Batchelder
This report is based on a presentation Funovits and Wing gave at Tradeline’s 2014 Conference on Strategic Facilities Planning and Management.


