To address space utilization and efficiency, especially in a research environment, the best way to make a case for change is with solid data that makes a compelling link to mission effectiveness, but institutions warehouse vast amounts of data that are often left untapped, says Donn Williams, director of facilities and real estate at RAND Corporation.
At RAND, badge swipes and human resources, timekeeping, staff directories, room assignment, room reservation, travel, and other enterprise databases are analyzed to paint a rich composite of the relationship between researchers, research activity, and research space.
Research and analysis literally is the core business process at RAND, so objective self-examination is always in the mix, notes Williams, but in trying to address space utilization for its research-oriented culture, RAND would need to frame this within larger questions.
“Mission effectiveness is what management is focused on, not empty space; space must be related back to mission effectiveness,” he says. “It is easy to talk to the CFO about space utilization and space efficiency. It is a different conversation when we are talking to researchers and research leadership. They are not thinking in terms of empty offices; they are thinking in terms of what people are doing, what they need, and what makes them effective.
“When engaging research leadership, we bring rich data to that conversation and try to bring that data alive.”
Creating a Big Picture from the Small Ones
RAND’s current facility plans are based on programming dating back to the late 1990s. Technology, work mobility, geographic diversity, and research market forces have changed profoundly over that time. The organization needed to take a fresh look at how they could improve efficiency and even more importantly, effectiveness, says Williams.
“RAND is rooted in big picture thinking, so we do not dwell on issues in isolation; we look at problems systematically. With space, we naturally think about how it is supporting our mission of improving public policy and decision-making. We are looking at data of how space is utilized, of course, but we do not just use that one point; we look at a lot of data and think how the system can be more effective.”
For example, when it comes to space efficiency, a key issue for RAND is social density, says Williams. “When you have lightly populated offices, fewer researchers are bumping into each other, and we care about that. That directly impacts effectiveness. The research is compelling regarding the value of informal collaboration.”
RAND has a wide array of academic disciplines represented on its staff. They work in a matrix supporting a variety of domestic and defense policy research. Research teams are multi-disciplinary, tend to be small, and are constantly in flux, as projects cycle through, explains Williams.
“As a result, understanding and characterizing our organization as a whole is quite challenging. There are many parts moving in many directions, so, in terms of accounting for space utilization and creating a conversation with research leadership, I have taken a lot of detailed data and abstracted it to create a clear composite picture that helps them make the critical connections.”
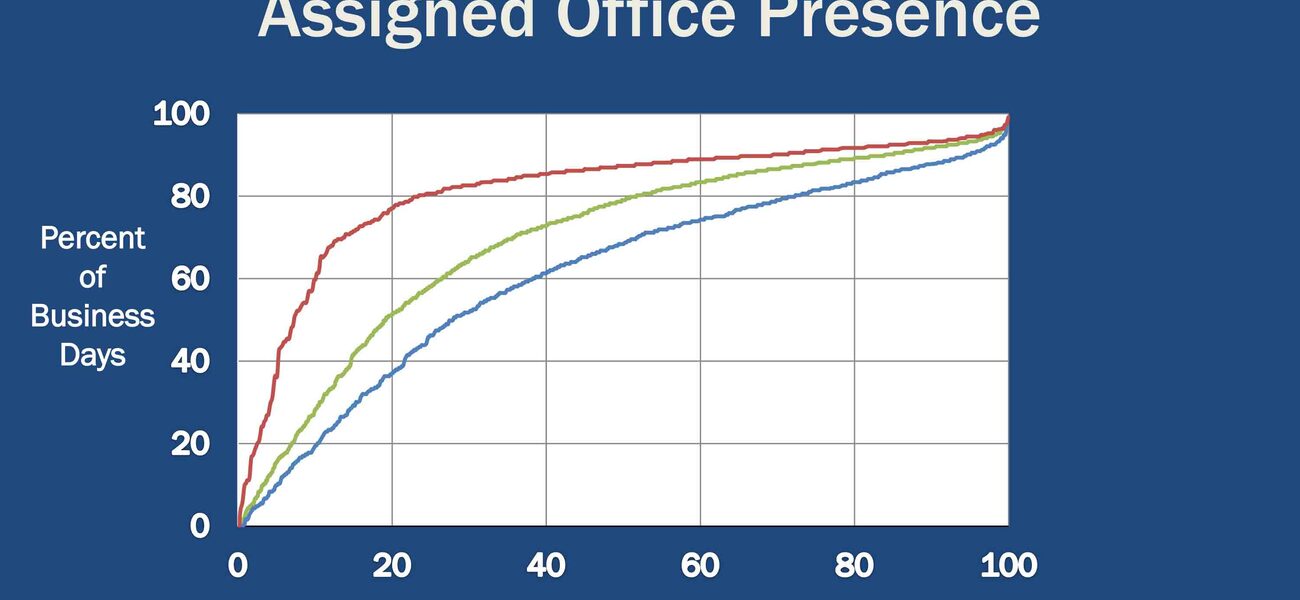
Williams and RAND’s data analysis staff merged badge swipe data with other existing enterprise databases to develop detailed staff profiles. The data was aggregated over several years and reported in histograms in order to illustrate the role of space in supporting mission activity. Once the data is compiled, it is relatively easy to answer complex and nuanced questions that come out of conversations with research leadership, according to Williams. Some key insights from the data that were of particular interest to research leadership were:
- It’s useful to separate the data for “support” personnel (those whose jobs are anchored in the office) from that of highly mobile staff. The highly mobile (research) staff accessed their assigned offices on average of about 60 percent of business days over the course of a year.
- Histogram distributions of individual profiles offer more insight than averages in understanding the implications of space strategies on mission performance. Solving for the average is likely to be sub-optimal for the majority, explains Williams. With the merger of databases, activity patterns were developed across office days, remote office days, other travel days, leave patterns, local work away from the office (often telecommuting), and unaffiliated days for part-time and adjunct staff.
“Since we are able to pull all this data together for research management, this is actionable information for them. We have very engaging conversations going on about these metrics. I am providing the data. They realize there are tradeoffs. With the right information, they will make the right choices about where the priorities are. The data and engagement on the topic is underpinning a planned space pilot to be launched in the next year.”
Conference Room Utilization
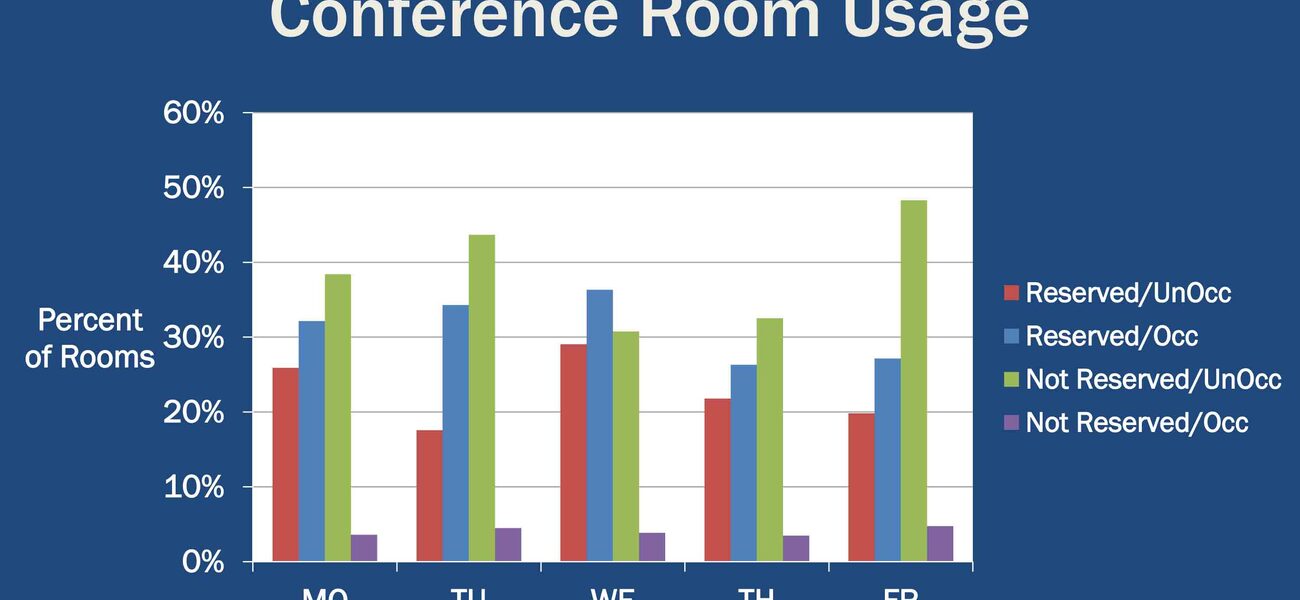
RAND noticed that conference rooms frequently were booked but not used, and rooms that were used were often lightly populated. This kind of underutilization is an issue he hears about from many companies, says Williams. RAND had excellent data on conference room reservations from its booking system, but no existing data on actual utilization.
In this case, Williams turned to RAND’s statistics group and asked if a simple sampling plan could be devised to create a valid statistical profile. The reservation data was evaluated, and a clipboard check sheet was produced to support a field sampling of room use. The resulting analysis provided many insights and demonstrated that RAND had about a 50 percent reservation abandonment rate. Also, most meetings involved only two to four people in the larger conference rooms.
“We already have plans to adjust both the amount and kind of real estate devoted to meeting spaces, based on the audit and analysis,” he says.
Making It Work in Different Organizations
While RAND has the advantage of a deep in-house analytic talent pool, data analytics resources are more plentiful than ever. “I think the opportunity is there for any organization to take its analysis to the next level,” notes Williams.
If organizations are missing key data, statistical sampling is relatively easy to put together to fill the data gaps. RAND’s conference room analysis took only a few hours of expert time, and most of the labor involved staff noting room occupancy parameters on clipboards and compiling the data.
“An objection I have heard is that facilities departments can’t get access to various company data. There needs to be some creativity and persistence. One strategy to overcome this is to do an analysis for your own group, for which you are more likely able to get data, and then share it with leadership stakeholders. If stakeholders see the potential value, they will become sponsors for more creative uses of existing enterprise data.”
Key points to remember are:
- Effectiveness over efficiency, and in the conversation with research leadership, talk about people. “Don’t come with a one-dimensional perspective about space utilization,” says Williams. “If you show a sophisticated understanding of what is going on with the totality of their staff, they will warm up to all of the other conversations.”
- Exploit enterprise data beyond corporate real estate. “Reach outside of your data domain. Tell a bigger picture. We have enormous amounts of data. We don’t necessarily need to go out and create a lot more.”
- Abstract and visualize. “Details matter, but don’t get lost in the weeds.”
By Taitia Shelow
This article is based on a presentation Williams made at Tradeline’s Space Strategies 2014 conference.


