A study at Yale University suggests that quantitative performance analysis of laboratory airflow may show more conclusive results than traditional methods of measurement, and thus obviate the perceived need for costly retrofits and upgrades in order to comply with the CDC/NIH’s new prohibition against reversal of airflow under failure conditions found in Biosafety in Microbiological and Biomedical Laboratories 5th Edition (BMBL).
Many laboratory validation and commissioning firms use the traditional gold standard for gauging airflow reversal: differential pressure. If a laboratory registers no positive pressure readings during a failure test, it passes. However, the CDC Select Agent Program admits that a slight positive pressurization is not necessarily an airflow reversal. In the event of a brief, weak positive pressure excursion, they allow for a re-test using an airflow indicator, such as a smoke stick or dry ice in water, to visually confirm whether any reversal is occurring.
But Yale University was unsatisfied with these re-tests. “Our colleagues in biosafety and EH&S thought it was a little bit subjective,” says Benjamin Fontes, biosafety officer at Yale. “We wanted more hard data. We were looking for quantitative analysis.”
This subjectivity was compounded by an essential question: Is differential pressure an appropriate gold standard? Does a simple number reflect the reality of a failure scenario? Fontes cites a paper by Alan Bennett and Simon Parks, which demonstrated that the practice of having researchers exit the laboratory in the event of a spill, simply opening doors can bring aerosols outside of the laboratory, which is not reflected by the standard testing. Furthermore, Bennett and Parks, in a separate publication, found that the volumetric inflow of air and the number of anterooms adjacent to a lab are the most critical factors in containment, not differential pressure.
Under the BMBL, laboratories are allowed to define their own edges, and Fontes stresses the importance of anterooms for laboratory failure scenarios. “Make sure that your anterooms are within the containment boundaries,” he says, and he discourages the cost-saving practice of not connecting anteroom exhausts to a facility’s high-efficiency particulate air (HEPA) filters.
Blowing Smoke
Yale wanted specific questions answered: Would their facility retain aerosols in the event of a spill? Would exiting the laboratory immediately after the spill bring aerosols into the anteroom? What impact would opening and closing adjacent doors in the facility have on the contained, static aerosols? What was the critical evacuation point (CEP), or the safe point past which aerosols would not spread in an absolute worst-case scenario, such as a spill outside of primary containment during a full system shut-down?
To answer those questions, researchers created a testing scenario that represented the practical realities of laboratory failure. They determined that, for their particular lab, spills would most likely happen in a triangular area between the centrifuge, the biosafety cabinet, and the incubator, as the result of samples dropped in transit or equipment malfunction.
First, they tested with light smoke, as a surrogate particle for spilled material. They also tested with heavy smoke, filling their laboratory with 23 milligrams per cubic meter by running a theatrical smoke machine for 15 seconds. The laboratory’s HVAC systems and biosafety cabinet were both turned off. “The reason we shut the biosafety cabinet off is that if you have a thimble-connected cabinet that remains on, pressure will remain negative as the cabinet pushes air from the laboratory to the plenum above,” says Fontes. Thus, if the biosafety cabinet stays on and is thimble-connected, even without a fan there is little likelihood of aerosols escaping the lab. They were also trying to emulate the conditions of a complete laboratory power failure.
The researchers used a particle counter and a light scattering photometer to measure total dust conditions before, during, and after the smoke release tests. The light smoke mode was more indicative of an actual spill condition. Heavy smoke conditions, which completely filled the room with a thick cloud of visible smoke, helped to identify the most likely places where aerosols would escape from the containment laboratory in the event of a spill.
The group was able to demonstrate, with a release of light smoke as a spill surrogate, that average particle counts and particle concentrations in the air were not elevated above background levels in the anterooms or in the hallway outside the laboratory. Light smoke data demonstrated that, despite slight low positive pressure readings during a worst-case scenario, such a spill at the time of exhaust fan failure or a full power outage, no particles emanated from the containment laboratory.
Practical Testing
The flaw with the smoke test is that it was, as one Yale researcher said, just not the same as the bacteria or viruses used in the laboratories. Researchers wanted to know what would really happen in the event of an actual spill of microorganisms. So the Yale group searched for a surrogate element that would allow quantitative analysis of a simulated spill. The answer came from not far down the hall: Yale’s containment flow cytometry laboratory uses fluorescent beads to test the containment of HEPA-filtered systems and containment hoods in their cell sorters under failure conditions. These beads come mono-dispersed, in very high concentrations per milliliter, and in very small particle sizes that can remain in the air for a long time and deposit in the lower lung.
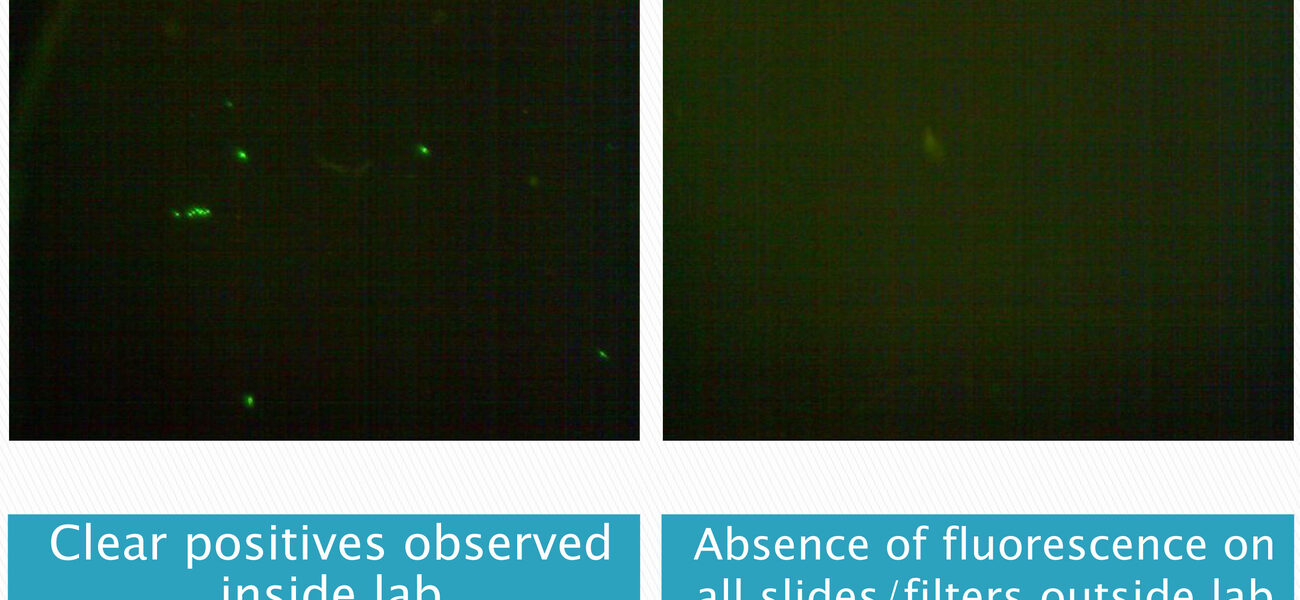
They were the perfect surrogate. “We were able to use an existing test, based on a test published in the International Society for Analytical Cytometry guidelines. (An updated version of these guidelines will contain information on the use of the fluorescent beads in addition to the use of Glowgerm particles in the current guidelines). The guidelines include an SOP for using the test that any interested facilities can modify in the testing and validation of their containment laboratories. Not only that, but the fluorescent beads are visible to the naked eye under a black light, which can also identify contaminant dispersion after a spill.
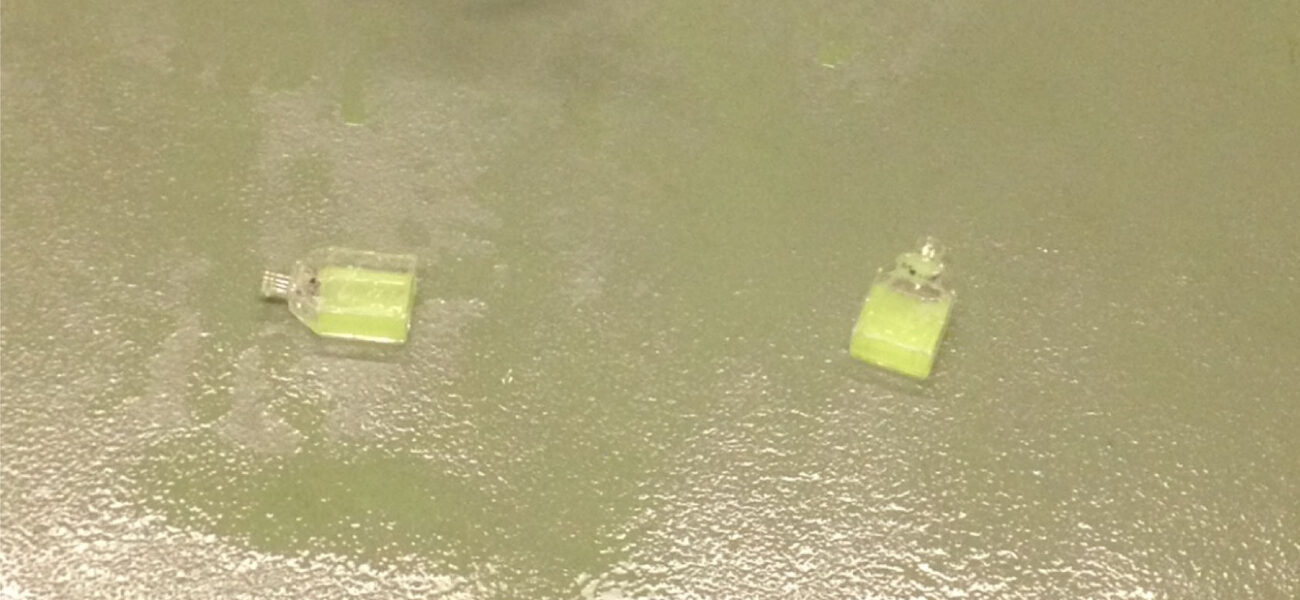
Yale decided on a three-flask test, each a 50-ml flask with 15 ml each of mock culture (one milliliter of fluorescent beads in phosphate buffer solution). They used a mixed population of bead sizes, one flask containing 0.5-micron beads, the other two with 2-micron beads. The three flasks were laid out in the previously identified danger triangle in one of Yale’s modern BSL-3 Enhanced laboratories, and results were measured with a Cyclex-D filter cassette at 20 liters per minute, and an Anderson sampler at 28.3 liters per minute.
Under normal operating conditions, with HVAC systems operating at their usual capacity (26 ACM, in their laboratory) in a 55-cubic-meter laboratory, they measured 322 beads per cubic meter. After shutting down the fans, however, that number rose to over 2,000 individual beads per cubic meter, which is within a similar quantitative range found by other researchers who identified the number of aerosols created in spill situations using actual microorganisms in their studies.
“With each test we have done with the fluorescent beads with primary to secondary, primary fan failure, shutdown of supply, activation of secondary fans, full power outage with all biosafety cabinets off, and the exit of individuals, we did not find a single bead on our Andersons or our Cyclex-Ds outside of the containment facility, which is just phenomenal,” says Fontes.
The practical application of their results is immediate and important. “When you are testing what could happen in your facility, you can tone down the test to something that is more realistic than filling the room with tracer gas particles or heavy smoke,” says Fontes. Not only are these tests more realistic, they are more effective, completely avoiding the often unavoidable positive pressure measurements in traditional differential pressure tests, which can lead to costly capital upgrades to laboratory HVAC and biosafety systems that may not be necessary, after all.
The regulators apparently agree. “Our surrogate spill test results were shared with the inspection team who visited our select agent laboratory, because we knew we would be showing them positive pressure readings in our facility,” says Fontes. “They went over quite well. We had no violations for not meeting the criteria there.”
By Braden T Curtis
This report is based on a presentation by Fontes at Tradeline’s 2013 International Conference on Biocontainment Facilities. Fontes is a chapter contributor to the new 2013 book Management Principles for Building and Operating Biocontainment Facilities. This book is available in eBook and paperback at Amazon.


