Research space at academic institutions increased 3.5 percent from fiscal year 2009 to 2011, one of the lowest two-year growth rates since a peak in 2001-03, according to the National Science Foundation's (NSF) most recent Survey of Science and Engineering Research Facilities. In that time period—the most recent data the NSF has—institutions planned fewer projects, and fewer projects came to fruition, an indicator that this "slow growth" trend will continue. The main growth area continued to be the biological and biomedical sciences.
Academic institutions spent $3.5 billion on major repairs and renovations during the cycle, and anticipate spending slightly less in 2012-13. The largest portion of funds in 2010-11 were designated for improvements to biological and biomedical space (37.5 percent); followed by health and clinical sciences (22.1 percent); engineering (12.4 percent); and astronomy, chemistry, and physics (10.3 percent).
“Overall, the trends seem to be that there’s still growth, but it’s slower growth than in the past,” says Michael Gibbons, project officer at the NSF’s Research and Development Statistics Program, National Center for Science and Engineering Statistics.
“I can’t say any of the findings were surprising. Science facilities are often cyclical; the amount of money that will be available year to year is not particularly predictable and can be affected by a lot of considerations,” says Norine Noonan, regional vice chancellor for academic affairs at the University of South Florida (USF) St. Petersburg. Noonan has served on six NSF advisory committees.
“These data probably reflect, more than anything else, the effects of the recession starting in 2007, particularly for public institutions which still rely mostly on public money to build academic/research facilities,” says Noonan.
The Survey and What it Measures
Congress mandated the Survey of Science and Engineering Research Facilities in 1986, and it has been completed in two-year cycles since then. The data for the latest survey was collected from 554 colleges and universities that expended at least $1 million in science and engineering research and development funds in 2010. The response rate for the survey was 97.7 percent, notes Gibbons, so it provides an encompassing snapshot.
“We’re fortunate to have such high participation, which allows us to present a census of virtually all institutions receiving major S&E funding.”
The survey asks for the net assignable square feet (nasf) of an institution’s research space by academic discipline, new construction projects, planned and deferred construction projects, and research space used for clinical trials or in a medical school.
The academic disciplines are divided into the following categories: agricultural sciences and natural resources sciences, biological and biomedical sciences, computer and information sciences, engineering, health and clinical sciences, mathematics and statistics, physical sciences, psychology, social sciences, and “other” fields that don’t fit into one category. If institutions have medical schools, some of their survey data is included in the biological sciences category and some in health and clinical sciences, says Gibbons.
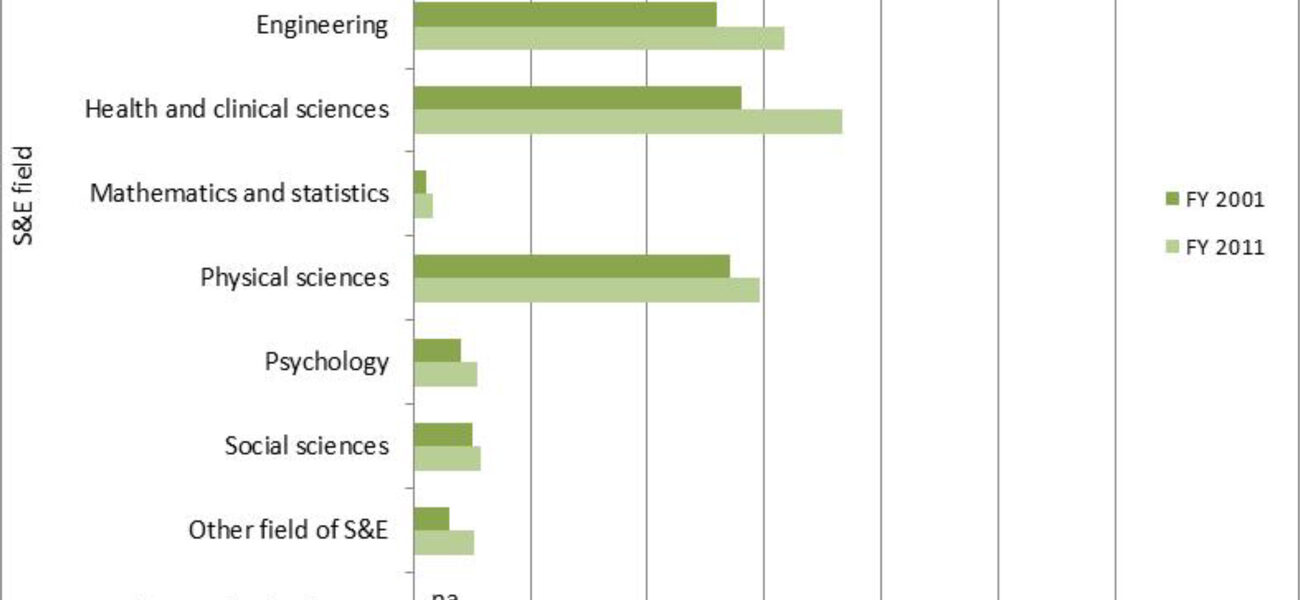
Total science and engineering research space grew from 196.1 million to 202.9 million nasf during the 2009-2011 cycle. This 3.5 percent increase is less than the median growth of 4.7 for the 11 biennial cycles from 1988 to 2011, notes Gibbons.
All institution types experienced net growth in research space except non-doctorate granting institutions, where research space declined 1.2 percent. The biological and biomedical sciences increased the most, by 8 percent, although that growth rate was less than the 12.3 percent growth rate in the previous cycle.
Research space for the physical sciences increased by 3.9 percent from 2009 to 2011, but growth was seen only in the subfields of astronomy, chemistry, and physics. Net assignable square footage for earth, atmospheric, and ocean sciences declined a few percentage points.
“It’s not surprising biomedical sciences were less affected by the recession, because many of those facilities are constructed in conjunction with medical schools or other kinds of activities where more private support is available, or where public/private partnerships are more likely to come together,” says Noonan. “These types of facilities also fit with the notion prevalent in most states that their function should be, in large part, to generate jobs.”
Construction, Repair, and Renovation Trends
Academic institutions’ construction plans don’t always come to fruition, which can be another telling indicator.
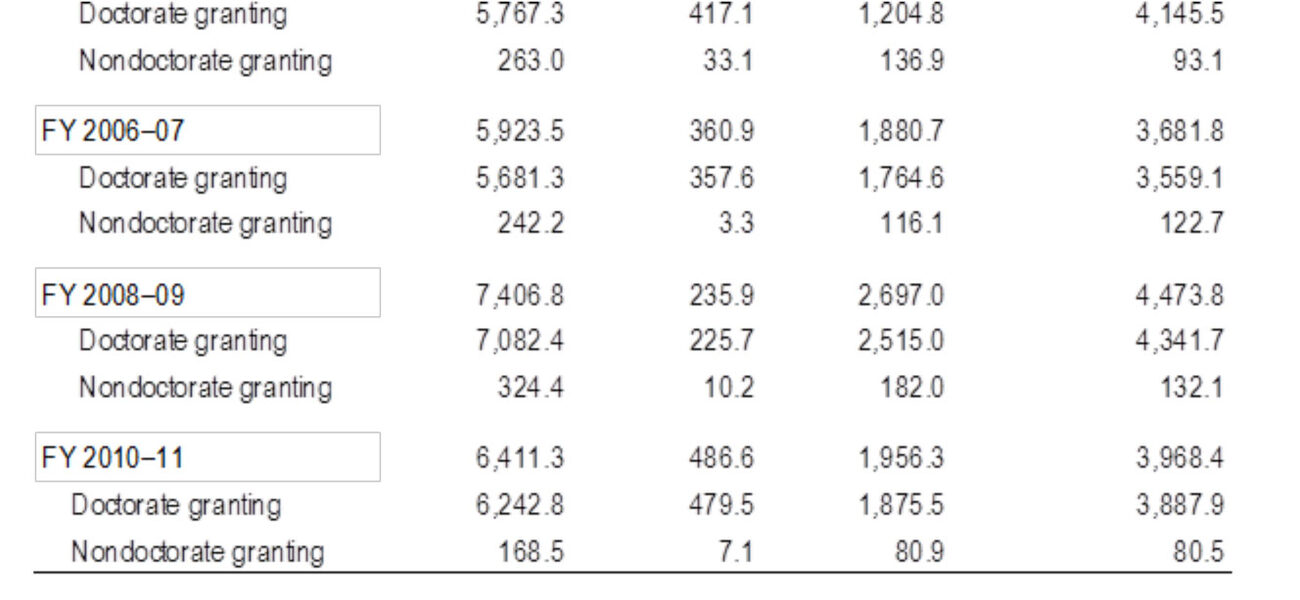
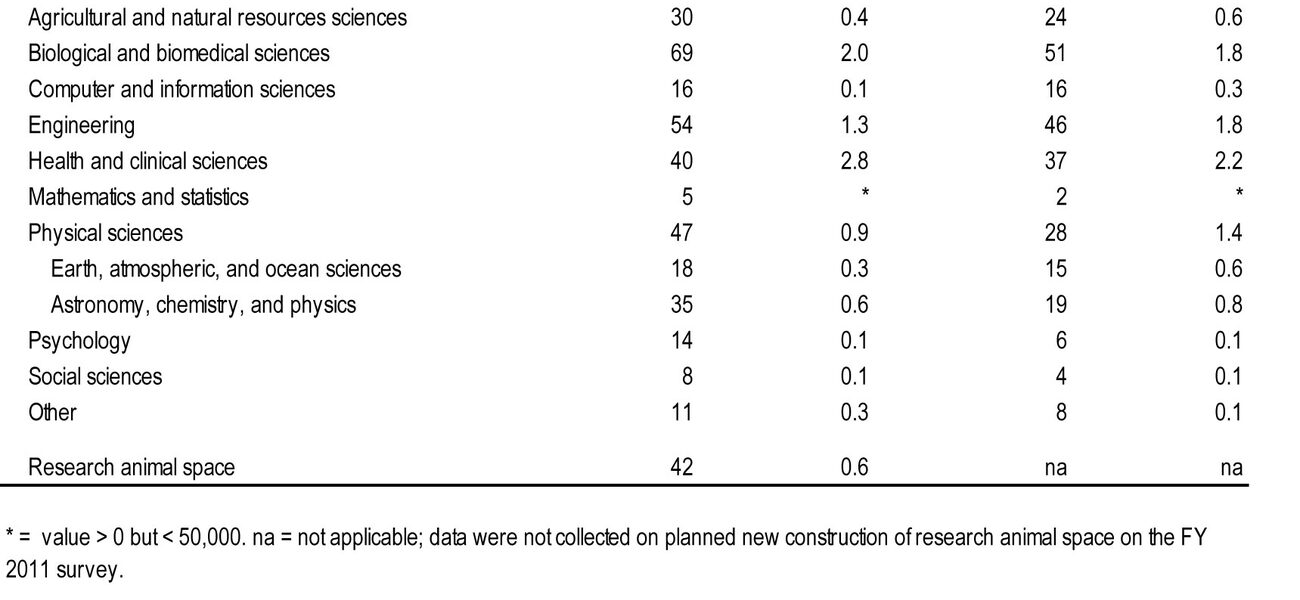
New construction of science and engineering research space begun in 2010–11 declined by 18.2 percent from the amount begun in 2008–09, and is 50 percent lower than the amount constructed in the most recent peak year, 2002–03, says Gibbons. The three fields of biological and biomedical sciences, health and clinical sciences, and engineering research space made up 75.3 percent of all new construction.
“The trend has been twofold: Institutions are estimating less construction space in each succeeding cycle, so the trend is going downward as to how much they are anticipating,” says Gibbons. “Thus, the amount of planned construction they are starting is also going down. We collect these data through a two-year window due to the longer time frames for construction planning.”
Thirty percent of the nation’s 554 research colleges and universities reported new construction of science and engineering research space in 2010–11 at a total cost of $6.4 billion. This was about $1 billion less than the estimated cost of new research space construction begun in 2008–09, in current dollars, says Gibbons.
The percentage of institutions reporting new construction has hovered around this 30 percent mark for the past four biennial cycles, following a peak of 46.5 percent reporting new construction in 2002-03, he adds.
The amount of new research space construction actually started by academic institutions has fallen well short of total net assignable square footage initially planned for construction over the past decade. The gap is shrinking, however, notes Gibbons, possibly because institutions are planning more carefully. The percentage of planned space that has actually been started has risen for the past four cycles, from 53 to 79 percent.
“Some of this is due to financial limitations and some is due to an increased awareness of sustainability, i.e., the most sustainable facility is the one that isn’t constructed,” notes Theodore (Ted) J. Weidner, senior director of project management and construction at Purdue University. Better planning includes decisions to renovate existing science and engineering space instead of constructing new space, he adds.
Noonan agrees. Her institution, like many others, is looking closely at maximizing square footage.
“Institutions are taking a hard look before undertaking new construction,” she says. “Research space can often be improved by gutting a building to the walls and renovating, because that’s often much cheaper. As money remains tight, those types of projects may be more attractive than trying to do the heavy financial lift of major new construction.”
The academic institutions surveyed by NSF reported another $4.8 billion in deferred repair and renovation projects included in their institutional plans, as well as $2.6 billion not included in their institutional plans. This is another factor that adds to existing financial burdens, notes Noonan.
Deferred repairs to science and engineering facilities are more closely attuned to the research and grant needs, and less to the building needs, says Weidner.
“There is the risk that some facilities will need more renovations in the future, but when resources are limited this is the better way to address institutional goals,” he adds.
Funding Sources and What the Future Holds
The federal government’s share of the funding for research space in the 2009-11 cycle ($487 million, or 7.6 percent, of the total cost) was the highest it’s been since 2004-05. State and local governments provided another 30.5 percent, or just under $2 billion. Almost 62 percent of the funding (nearly $4 billion) for new research space came from the institutions’ funds and other sources.
“The federal share is higher than it has been, but that can also mean there are fewer alternative funding sources in the current climate,” notes Gibbons. “We’ve seen some fluctuations over the past 10 years, but overall, total funding is down from the prior cycle. State and local funding is less, as well as other sources.”
Data on the institutions’ share of the funding has averaged 63.6 percent over the past five cycles, he adds. So the latest figure is only slightly below average.
“It’s difficult to anticipate the direction funding will take until we collect more data, but we know that institutions are being forced to think creatively when exploring funding sources and planning for construction and renovation,” says Gibbons.
Noonan doesn’t anticipate the share of government funding will increase dramatically in the near future, either. Even though many state economies seem to be improving, governments are still cash-strapped.
“As the economy continues to recover, I think you will see an uptick over time. I wish I had a crystal ball, but I think planned construction will continue on the slow growth trend,” she says.
“I think what we are going to see in the future is more public/private partnerships. In my state now, that is the buzzword. This is absolutely going to be the up-and-coming thing. Forward-thinking contractors, developers, and institutions should be looking for those types of partnerships.”
By Taitia Shelow


